Measuring progress
The dashboard is the first step of the opportunity menu. As well as being able to publish your opportunity, you also have access to the following graphs:
-
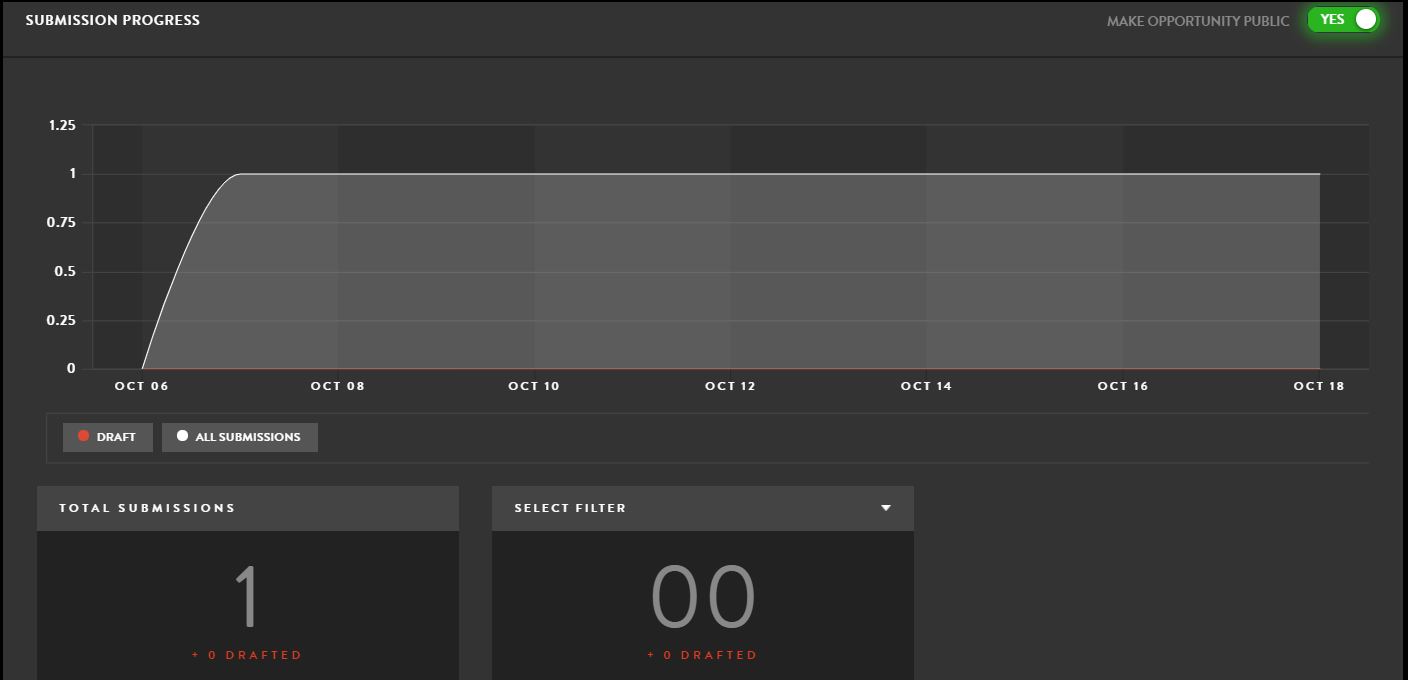
Submission Progress – this shows you how many completed submissions you have, as well as any drafts, and the dates they were received

-
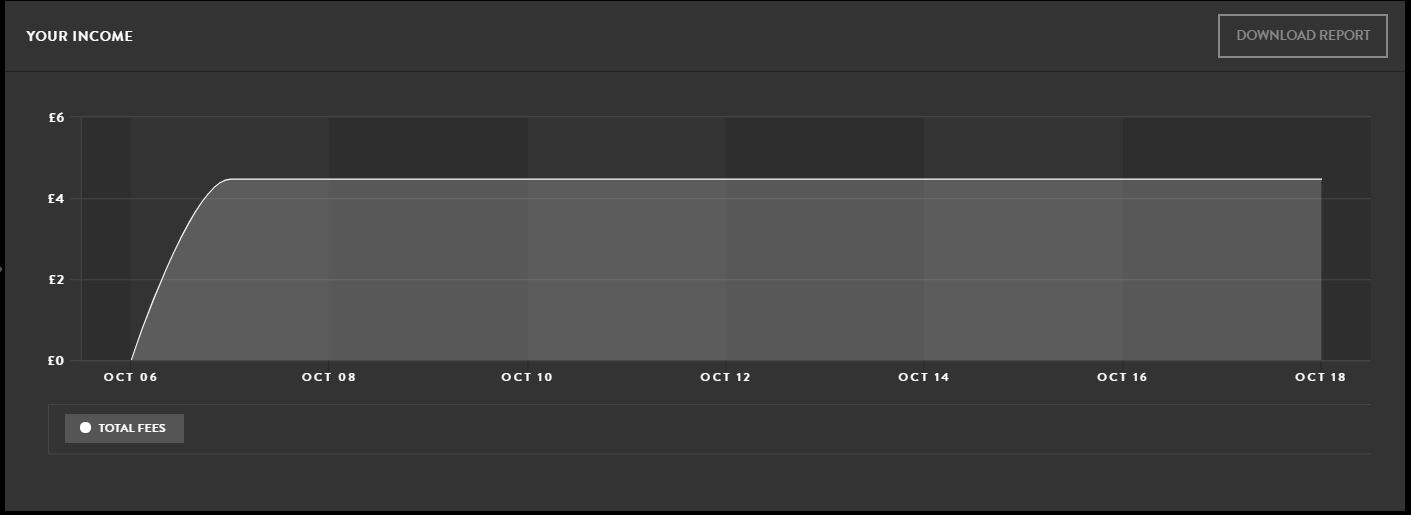
Your Income – if you are taking submission fees, this graph will be available to show you the fees you have made and the dates
-
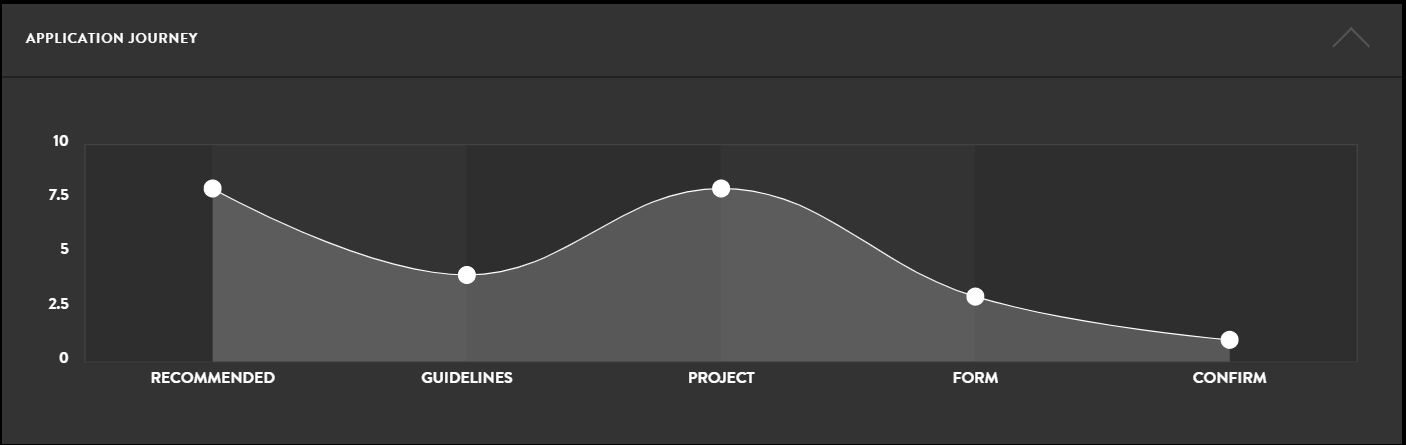
Applicant Journey – this graph takes you through where applicants are on their journey and where some of them may be dropping out, which allows you to find where to improve your call out.
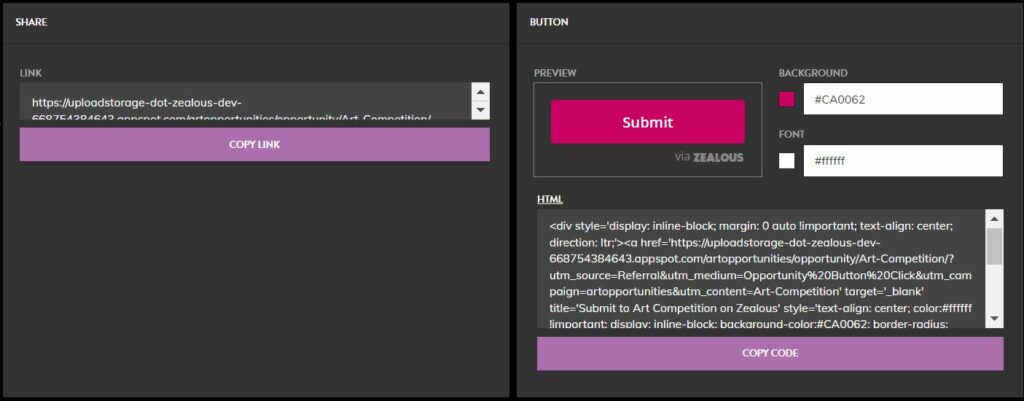
It is in the Dashboard where you can also share your call, through sharing the link or embedding the button on your website.